LinkedIn
 Facebook
 Email
Email
 Twitter
 Quickly evaluate current rents with QuickView™ Rent Estimates


Make Confident Rent Decisions with the Rentometer Pro Report
Last updated: February 18, 2026
Analyze Rental Comps, Trends & Property Data—All in One Place
Whether you’re underwriting a rental property, pricing a new listing, or preparing a rental market analysis for a client, confident decisions start with reliable data.
A professional rental comps report should go beyond simple averages. It should show you:
- Comparable rental properties
- Historical rent trends
- Market distribution data
- Property-level public records
The Rentometer Pro Report combines all of this into one comprehensive rental market analysis report—so you can price accurately, validate assumptions, and defend your numbers with confidence.
Stay connected
Get rental market insights delivered straight to your inbox.
What Is a Rental Comps Report?
A rental comps report (short for “rental comparables report”) analyzes nearby properties similar to your subject property to determine a fair and competitive rent price.
Professional rent analysis reports typically include:
- Comparable rental listings
- Rent ranges and percentiles
- Historical pricing trends
- Neighborhood context
- Property-level public records
The challenge? Most online tools provide only basic averages. A professional-grade rental property analysis report should give you the full context behind the numbers.
That’s where the Rentometer Pro Report stands apart.
How the Rentometer Pro Report Works (Step-by-Step Guide)
Want to see the Pro Report in action before diving in? Watch our short tutorial to learn how to access the report and how professionals use it to make smarter pricing decisions.
How to Access the Pro Report
To get started, run a QuickView™ Rent Estimate for your property. Once the estimate is generated, click the “View Pro Report” button to unlock the full report using one Pro Report credit.

💡 Tip: For the most accurate rent estimate, follow these best practices when searching addresses and applying filters.
Your interactive Pro Report loads in seconds, giving you a complete picture of the rental market surrounding your property.
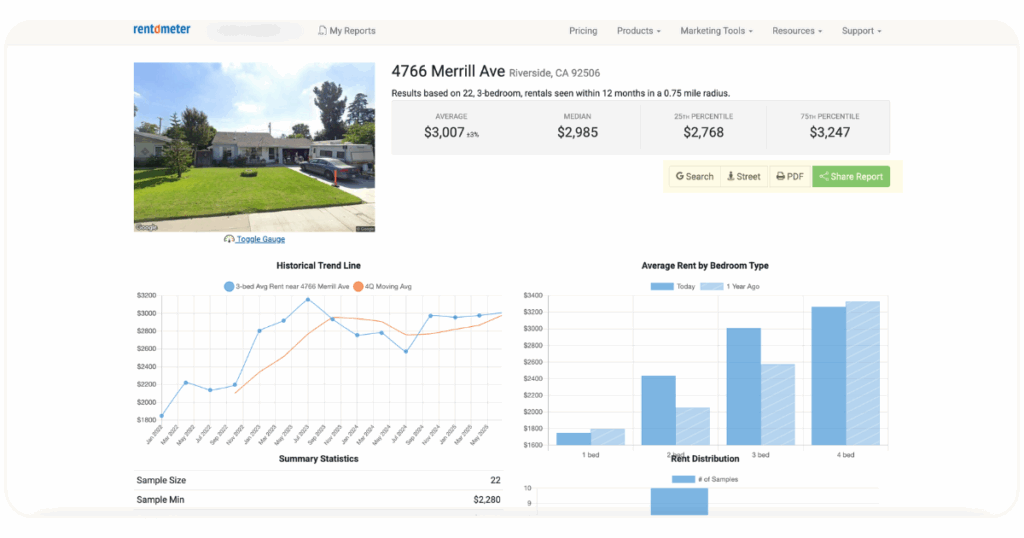
Rent Estimates & Market Analysis Overview
Rent Estimates & Market Snapshot
At the top of the report, you’ll see Google Street View of your subject property—providing immediate visual context of the surrounding area.
Next to it is a rent estimate summary, including:
- Average rent
- Median rent
- 25th and 75th rent percentiles
All values are based on comparable nearby rentals.
Why this matters:
This snapshot helps you quickly assess whether your target rent is conservative, aggressive, or aligned with the market—before diving deeper into analysis.
Built-In Tools for Sharing & Research
At the top of the Pro Report, you’ll find tools designed to make research and collaboration easier:
- Google Search: Quickly research listings, photos, or sale history
- Street View: Explore the neighborhood virtually
- Print Report: Save or download a clean, client-ready PDF
- Email Share: Send a branded Pro Report directly to clients or partners
💡 Branding Tip: Custom branding appears in the PDF version of the Pro Report, making it ideal for sharing with clients or partners.
Why this matters:
These tools turn raw data into a polished deliverable you can confidently share—without extra formatting or manual work.
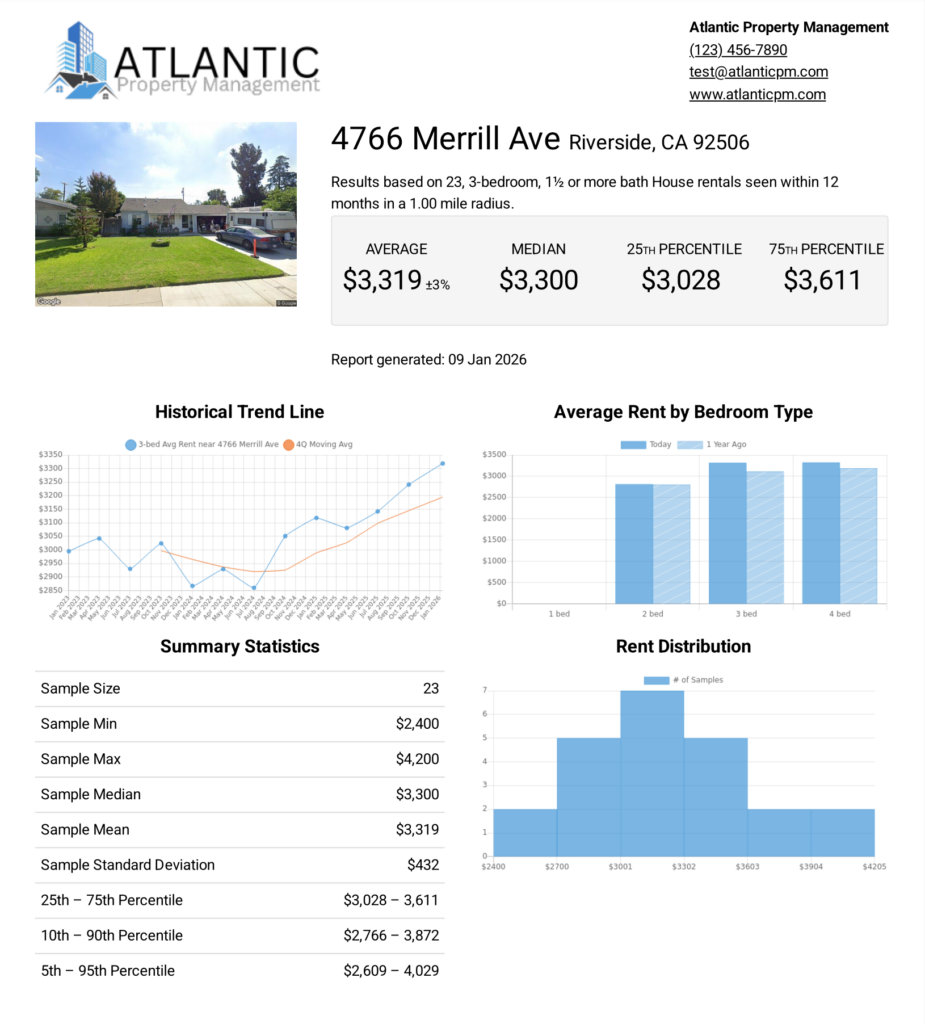
Interactive Charts & Summary Analysis
This is where the Pro Report moves beyond basic rent estimate calculators and delivers a true rental market analysis.
Key visuals include:
- Historical Rent Trends: Track rent changes over the past three years
- Average Rent by Bedroom Type: Compare 1–4 bedroom pricing instantly
- Summary Statistics: Sample size, rent range, and variability
- Rent Distribution: Identify pricing clusters and outliers
Why this matters:
Charts help you avoid pricing decisions based on outdated assumptions or outlier comps—and instead anchor decisions in statistically meaningful data.
🔹 For Real Estate Investors
Use these charts to:
- Validate rent assumptions before submitting offers
- Spot seasonality or volatility that affects cash flow
- Support underwriting models with real trend data
Confidently Underwrite Deals →
🔹 For Agents & Brokers
Use these insights to:
- Justify list pricing with historical data
- Educate clients visually—not just verbally
- Reduce pricing objections with market-backed evidence
Create a Client-Ready Pro Report →
🔹 For Property Managers
Use charts to:
- Set competitive rents that minimize vacancy
- Monitor rent trends across portfolios
- Communicate rent decisions effectively with clients
Justify Pricing Decisions Today →
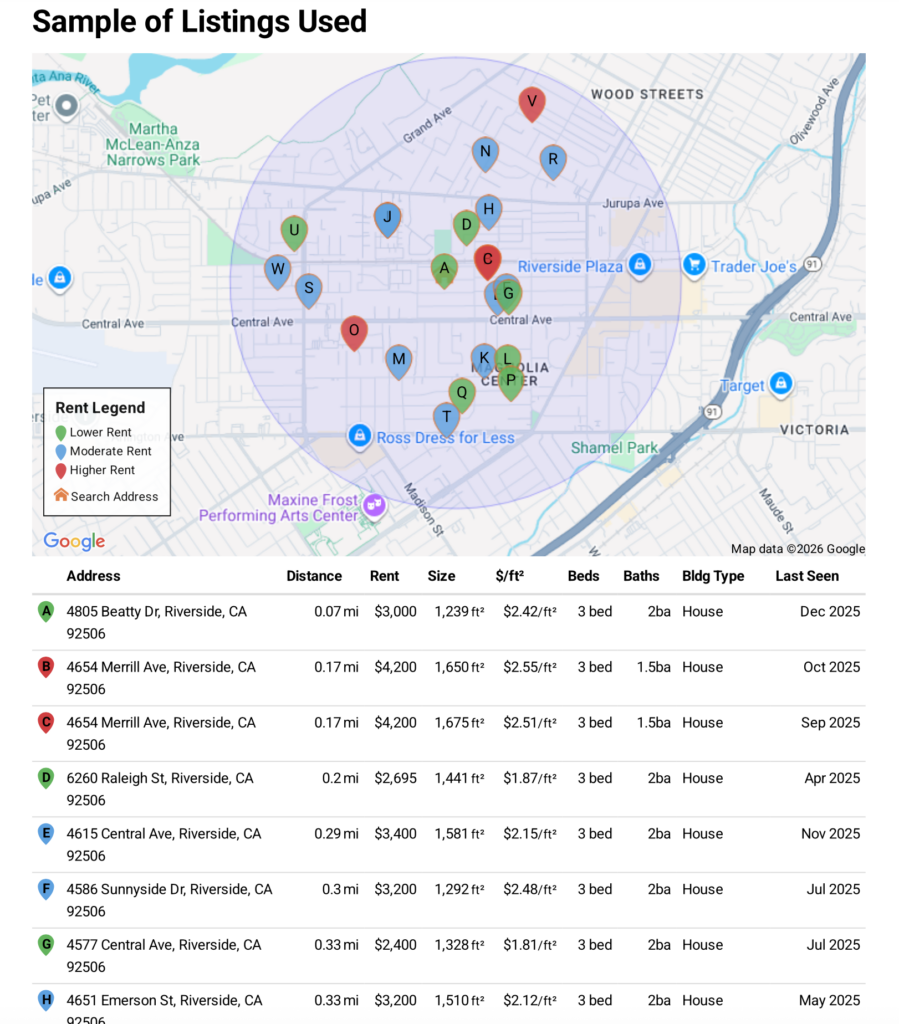
Detailed Rent Comps
Each comparable rental is carefully selected based on proximity and property similarity, giving you a defensible basis for pricing decisions—not just broad ZIP-code averages.
Interactive Map of Rental Comparables
The interactive map displays all rental comps used in your report, allowing you to visually explore pricing by location.
You can:
- Zoom into neighborhoods
- Click pins to view comp details
- Identify pricing tiers with color-coded markers
- Access Street View for neighborhood context
Why this matters:
Seeing where comps are located relative to your property helps you quickly assess relevance and defend pricing decisions spatially—not just numerically.
Detailed List of Comparable Properties
Scroll further to view up to 25 comparable rentals, including:
- Address of comparable property
- Convenient link to open google search or property
- Distance to subject property
- Rent price
- Sq. ft and price/sq. ft
- Property specs
- Last seen date
You can sort the table of comps by price, proximity, or recency—and export the full list as a CSV.
Each comp includes it’s own Property Details report, which has:
- Google street view
- Historic rent data
- Listing info
- Public record details
Why this matters:
This level of transparency allows you to audit the data behind your rent estimate—and confidently defend it when questioned.
Download Rent Comp Data as a CSV
Need to analyze comps outside the platform? Export the full comp list with one click.
Perfect for:
- Investor underwriting models
- Brokerage presentations
- Portfolio-level analysis
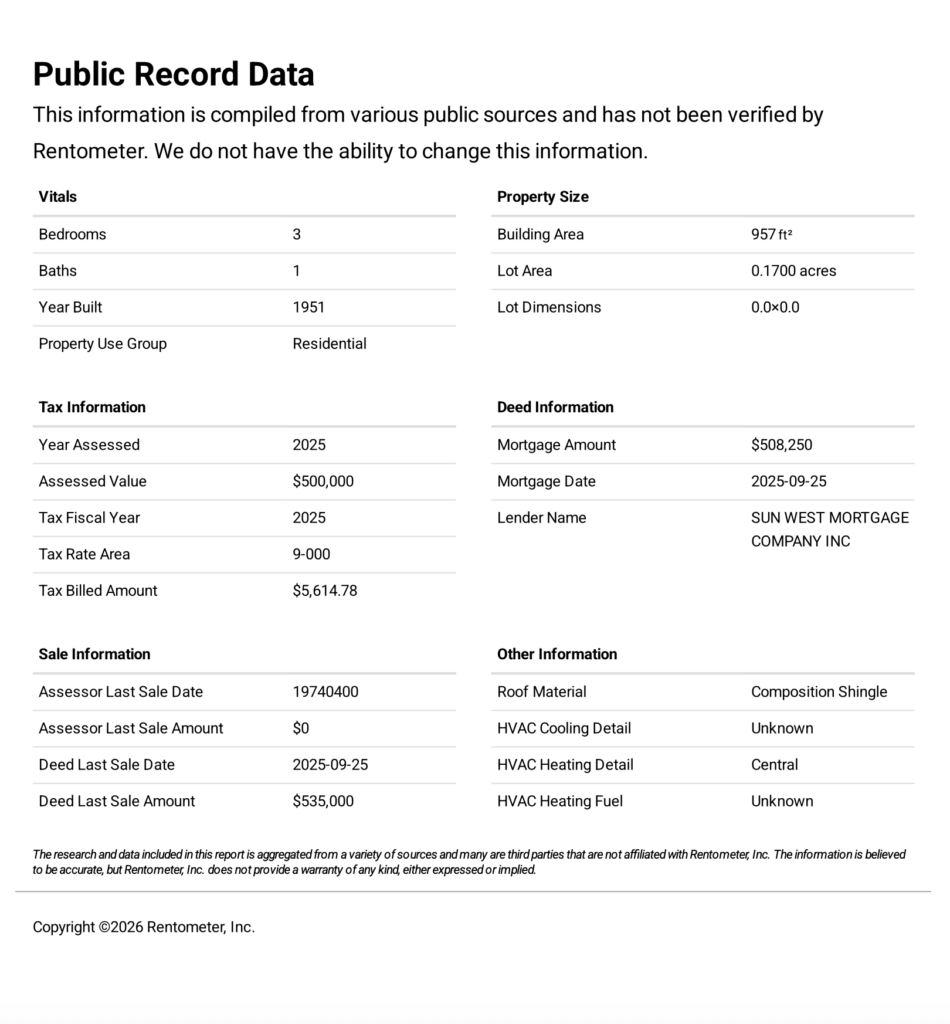
Public Record Data for Your Subject Property
Toward the end of the report, you’ll find a detailed section with public record data specific to your The Pro Report also includes detailed public record data, such as:
- Property characteristics
- Assessed value & annual tax billed amount
- Sales history
- Mortgage & deed information
- Structural features
Why this matters:
Public record context helps you evaluate risk, validate assumptions, and understand the full financial picture of a property—not just its rent potential.
View Sample Pro Report PDF with Custom Branding
Why Use a Professional Rental Analysis Report Instead of Multiple Tools?
Many investors and agents piece together rent comps from listing sites, public record searches, and spreadsheets.
This approach:
- Takes hours
- Increases risk of outdated data
- Makes it harder to defend pricing decisions
The Rentometer Pro Report consolidates rental comps, trends, and public record data into one cohesive, shareable report—saving time and increasing confidence.
Turn Rent Data into Confident Decisions
The Rentometer Pro Report is built for professionals who can’t afford to guess rents.
Whether you’re analyzing a deal, pricing a rental, or advising a client, the Pro Report gives you the comps, trends, and context needed to make confident, defensible decisions—fast.
Instead of stitching together data from multiple sources, get everything in one report you can trust.
Stay connected
Get rental market insights delivered straight to your inbox.