

Report Summary
Rentometer compiled an analysis of 3-BR SFR rent prices in 508 cities across the U.S. to see how
much they have changed since this time last year.
Some key highlights from the nationwide analysis are as follows:
- 89% of cities experienced year-over-year rent increases
- 36% of cities experienced double digit year-over-year rent increases, which is down from 60%
last quarter
The remainder of this report contains our nationwide analysis of Q2 2023 average rent prices and
how they have changed over the past year.
Methodology
What was the methodology we used to complete our nationwide rent price analysis?
- Geography: SFR markets in 508 U.S. cities across six regions.
- Property type: 3-BR SFRs with all bathroom counts.
- Analysis: Rent data was analyzed year-over-year for Q2 2022 and Q2 2023.
- Data: Includes data collected and updated between April 1st and June 30th for 2022 and 2023.
- Exclusions:
- Cities with fewer than 25 new or updated rentals within any quarter were excluded.
- Rentals below $500 (minimum price) or above $10,000 (maximum price) were excluded.
Nationwide Rent Price Analysis
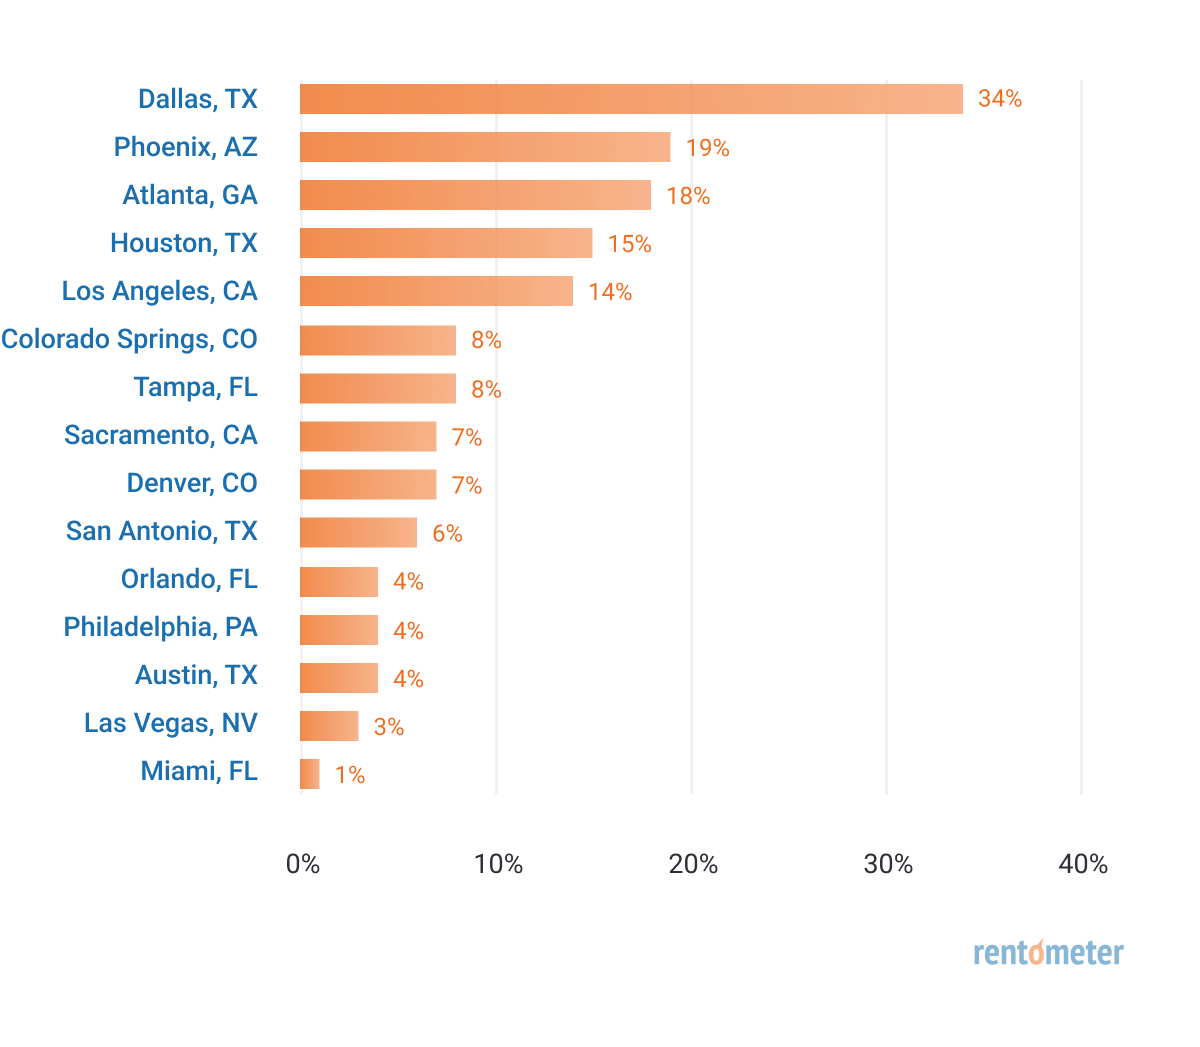
The orange bar graph below shows the year-over-year rent changes across fifteen major cities in the U.S. Of these fifteen markets, Dallas, Texas had the largest year-over-year rent increase of 34%, with Phoenix, Arizona and Atlanta, Georgia shortly behind with rent increases of 19% and 18%, respectively. Miami, Florida had the smallest rent increase of 1%.
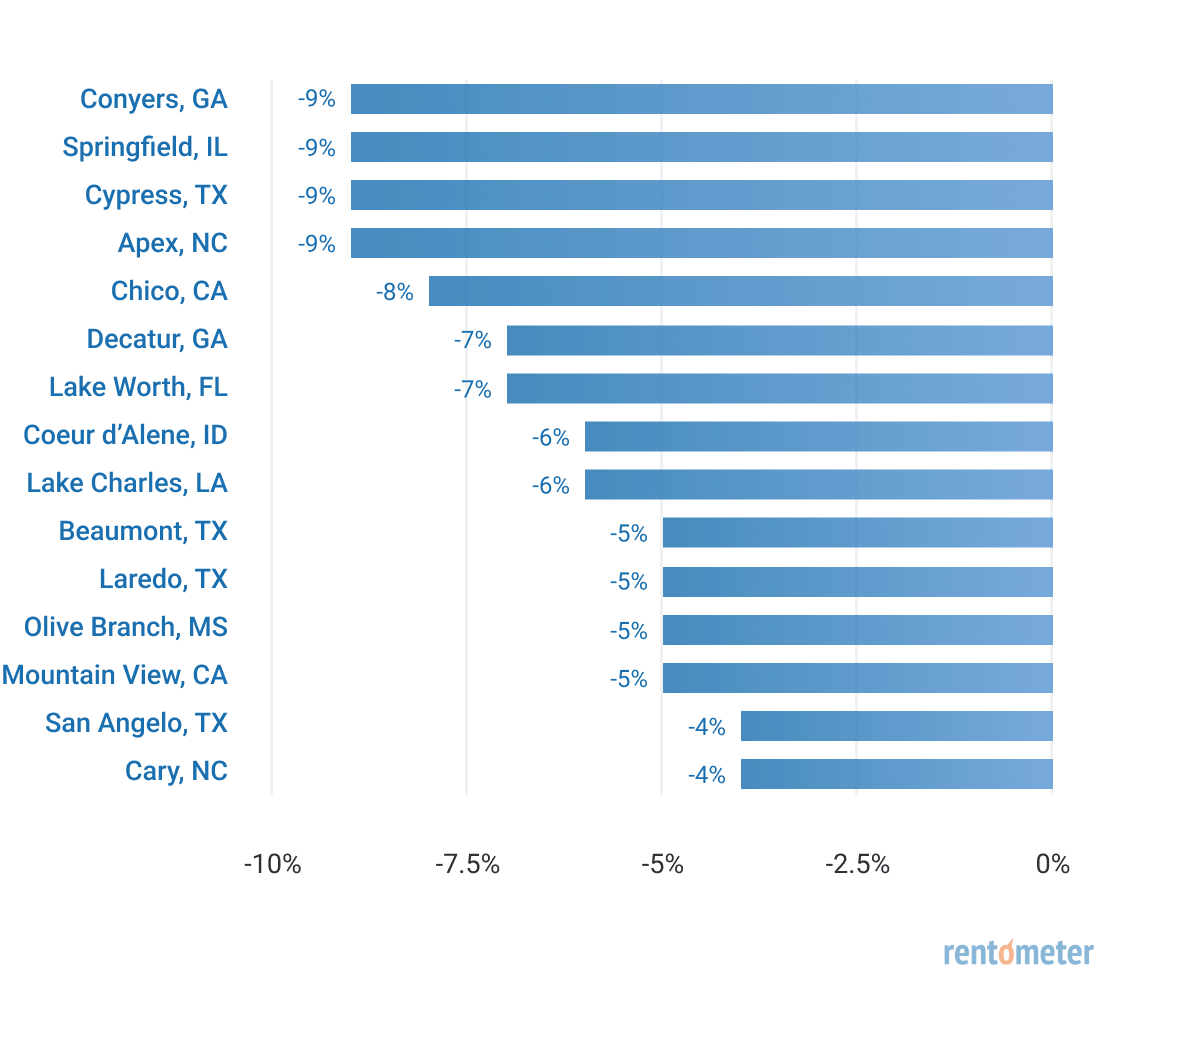
The blue bar graph below shows the fifteen markets that had the largest rent decreases in Q2 2023. Out of the 508 cities represented in this report, only 39 markets saw rent decreases. Of these fifteen markets, Conyers, Georgia had the largest year-over-year rent decrease of -9%, while Cary, North Carolina had the smallest decrease of -4%.
Midwest Rent Price Analysis
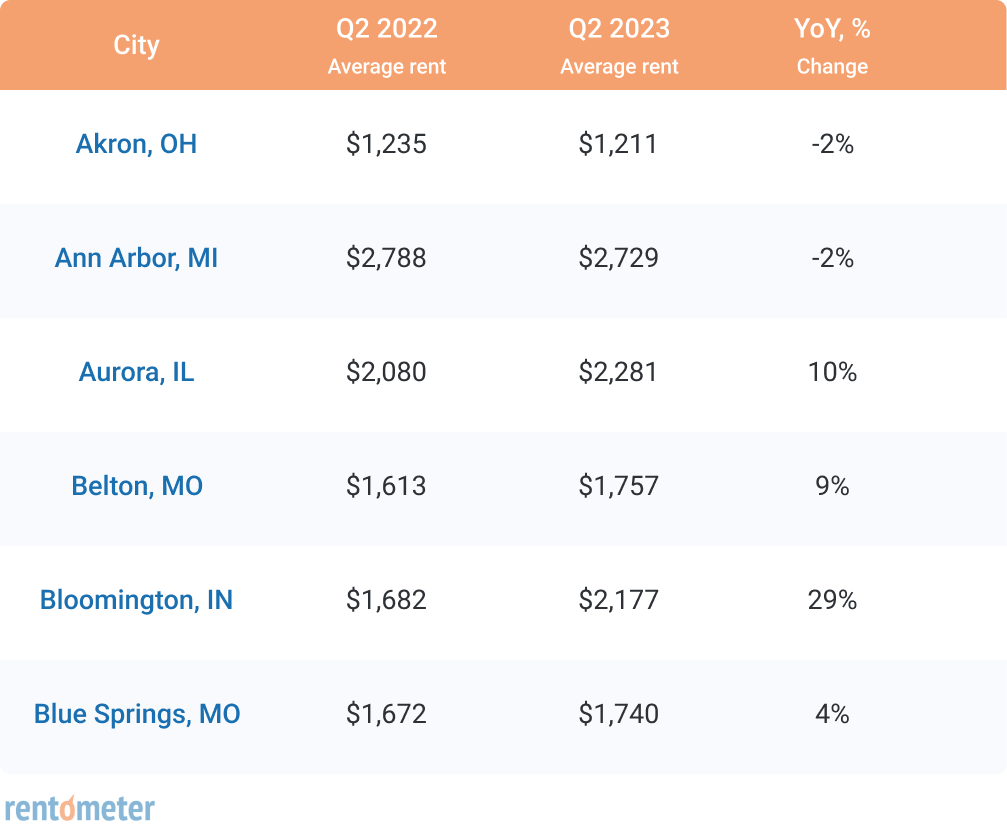
Rent Price Changes in the Midwest
In the Midwest, Bloomington, Indiana had the largest year-over-year rent increase of 29%, while Springfield, Illinois had the largest decrease of -9%.
Rent Prices in Popular Midwest Markets
- Chicago, IL rent for a 3-BR SFR: $2,570
- Kansas City, MO rent for a 3-BR SFR: $1,585
- Minneapolis, MN rent for a 3-BR SFR: $2,356
Northeast Rent Price Analysis
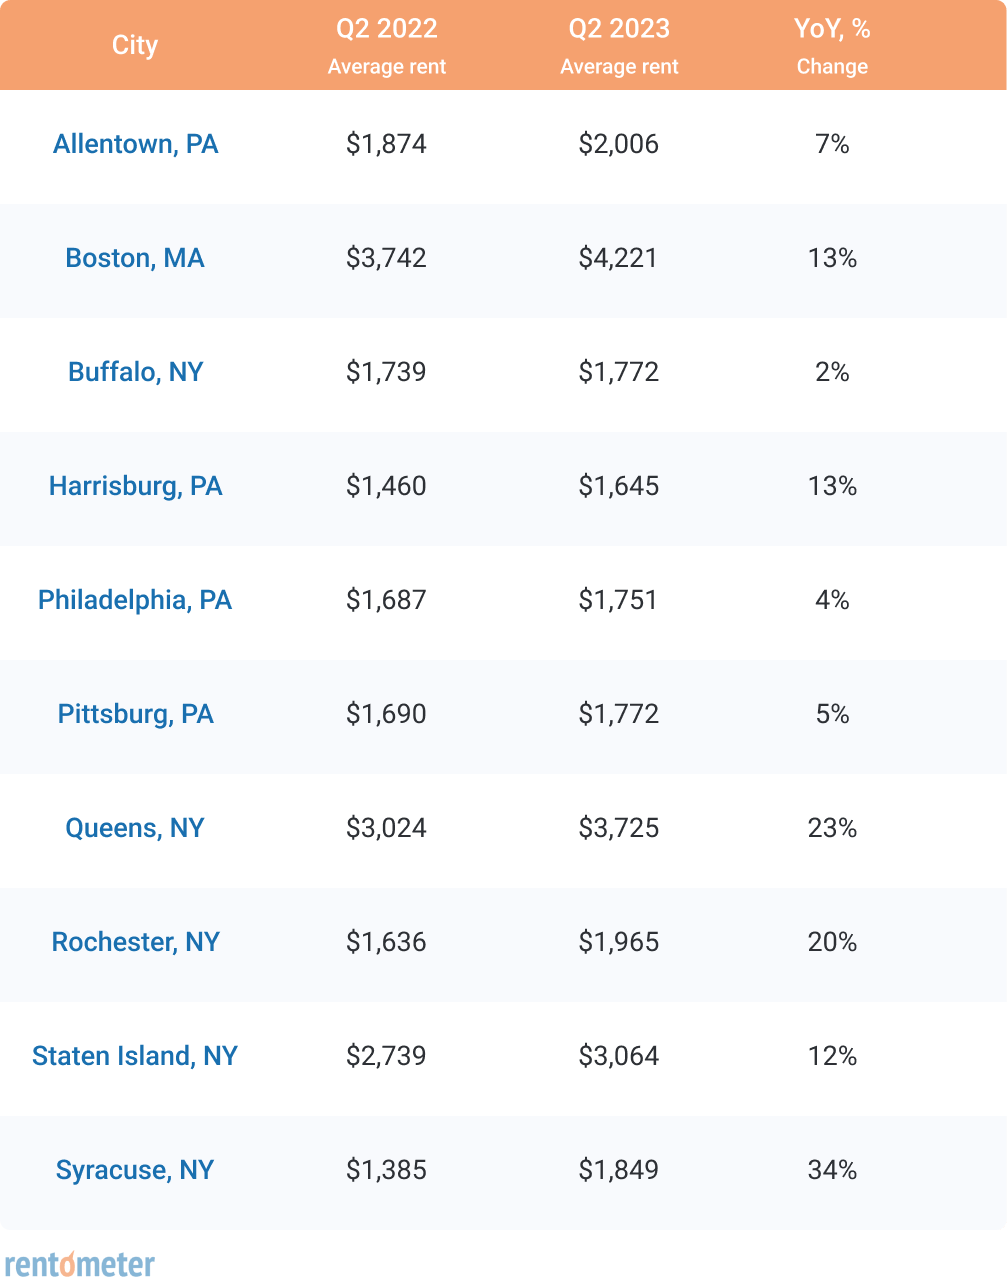
Rent Price Changes in the Northeast
In the Northeast, Syracuse, New York had the largest year-over-year rent increase of 34%, while Buffalo, New York had the smallest increase of 2%.
Rent Prices in Popular Northeast Markets
- Boston, MA rent for a 3-BR SFR: $4,221
- Philadelphia, PA rent for a 3-BR SFR: $1,751
- Pittsburgh, PA rent for a 3-BR SFR: $1,772
Pacific Rent Price Analysis
Rent Price Changes in the Pacific
In the Pacific, Long Beach, California had the largest year-over-year rent increase of 30%, while Chico, California had the largest decrease of -8%.
Rent Prices in Popular Pacific Markets
- Los Angeles, CA rent for a 3-BR SFR: $5,071
- San Diego, CA rent for a 3-BR SFR: $4,832
- San Francisco, CA rent for a 3-BR SFR: $5,265
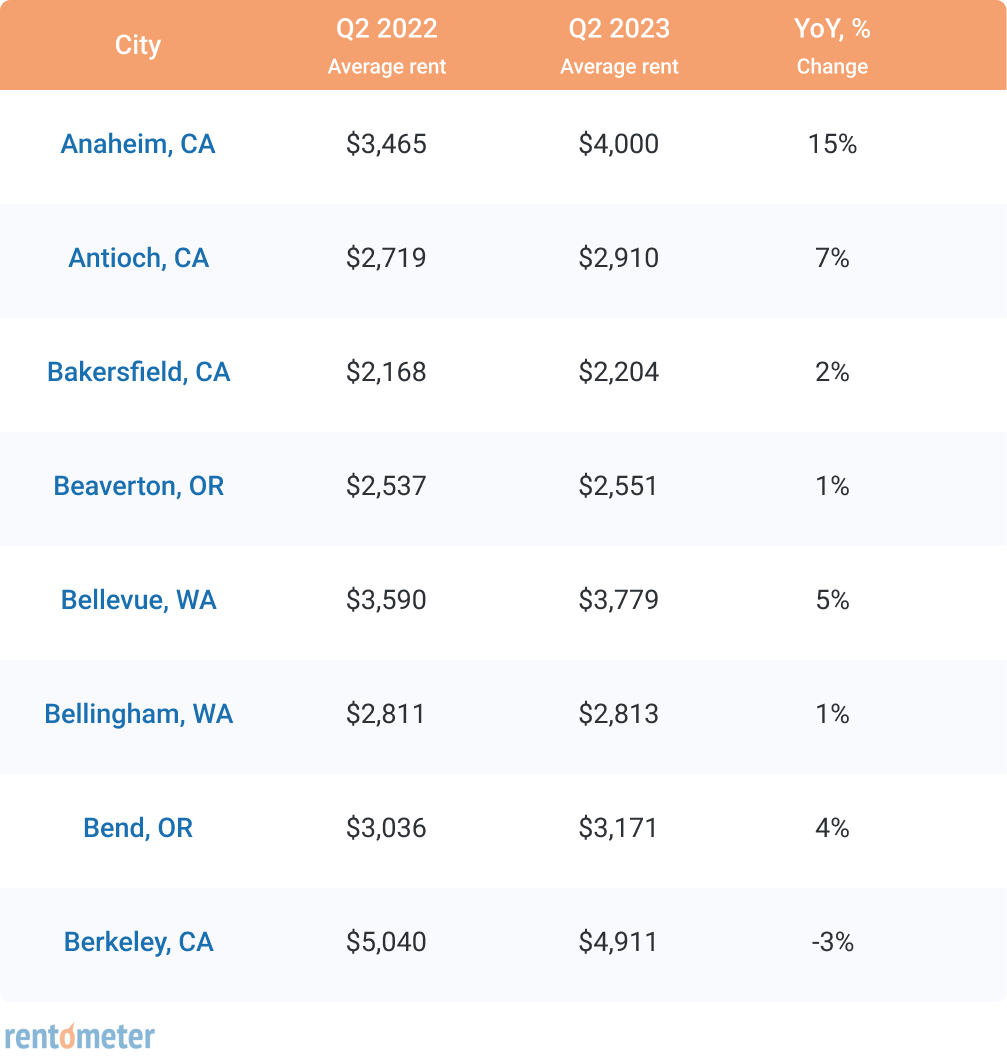
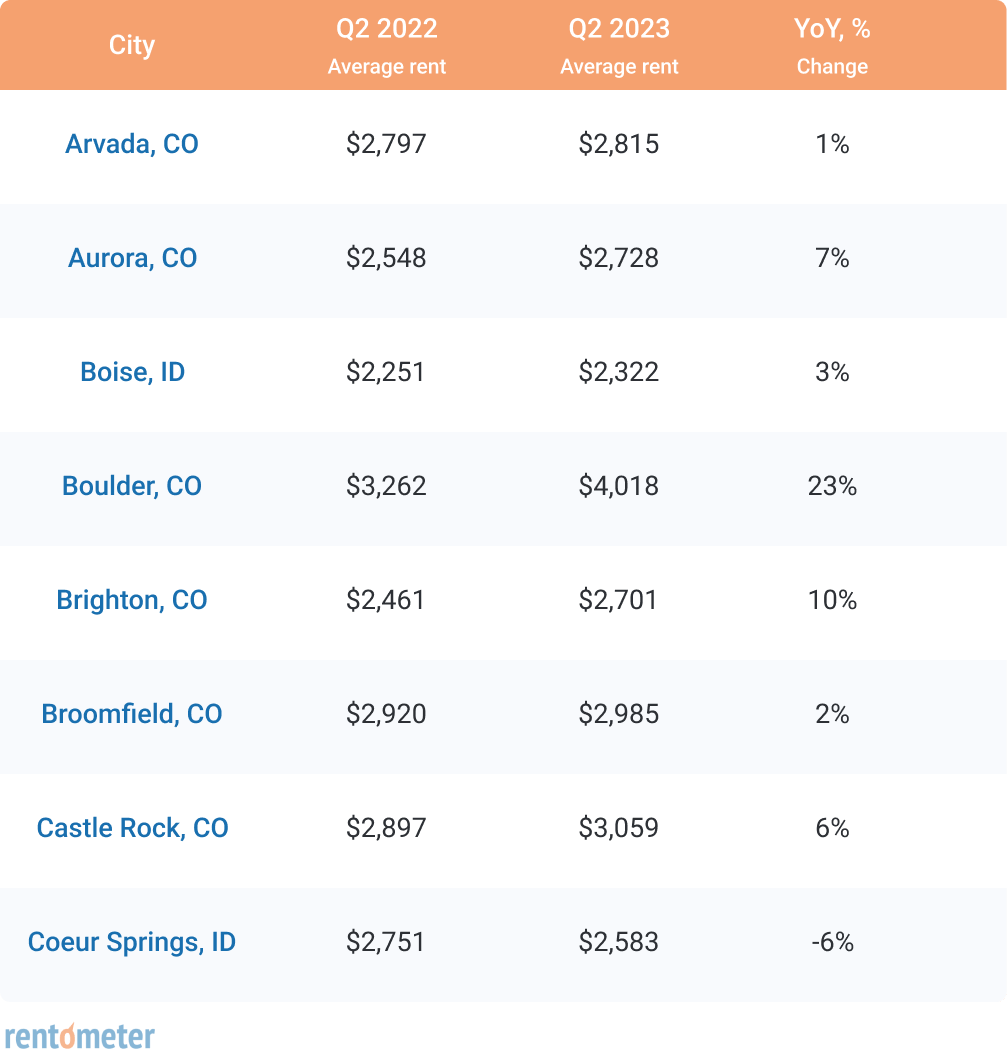
Rocky Mountains Rent Price Analysis
Rent Price Changes in the Rocky Mountains
In the Rocky Mountains, Boulder, Colorado had the largest year-over-year rent increase of 23%, while Coeur d’Alene, Idaho had the largest decrease of -6%.
Rent Prices in Popular Rocky Mountains Markets
- Colorado Springs, CO rent for a 3-BR SFR: $2,299
- Denver, CO rent for a 3-BR SFR: $3,110
- Las Vegas, NV rent for a 3-BR SFR: $2,234
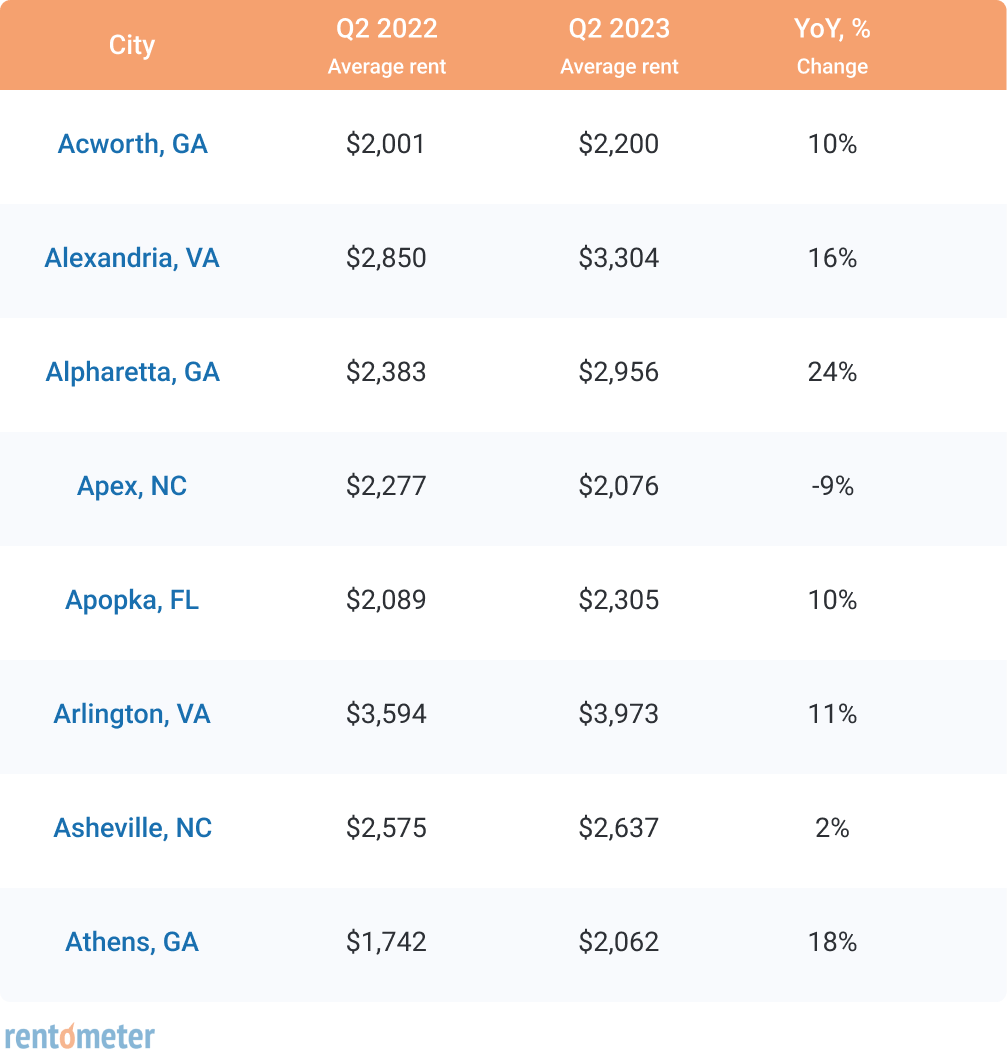
Southeast Rent Price Analysis
Rent Price Changes in the Southeast
In the Southeast, Charleston, South Carolina had the largest year-over-year rent increase of 36%, while Conyers, Georgia had the largest decrease of -9%.
Rent Prices in Popular Southeast Markets
- Atlanta, GA rent for a 3-BR SFR: $2,644
- Miami, FL rent for a 3-BR SFR: $4,255
- Orlando, FL rent for a 3-BR SFR: $2,268
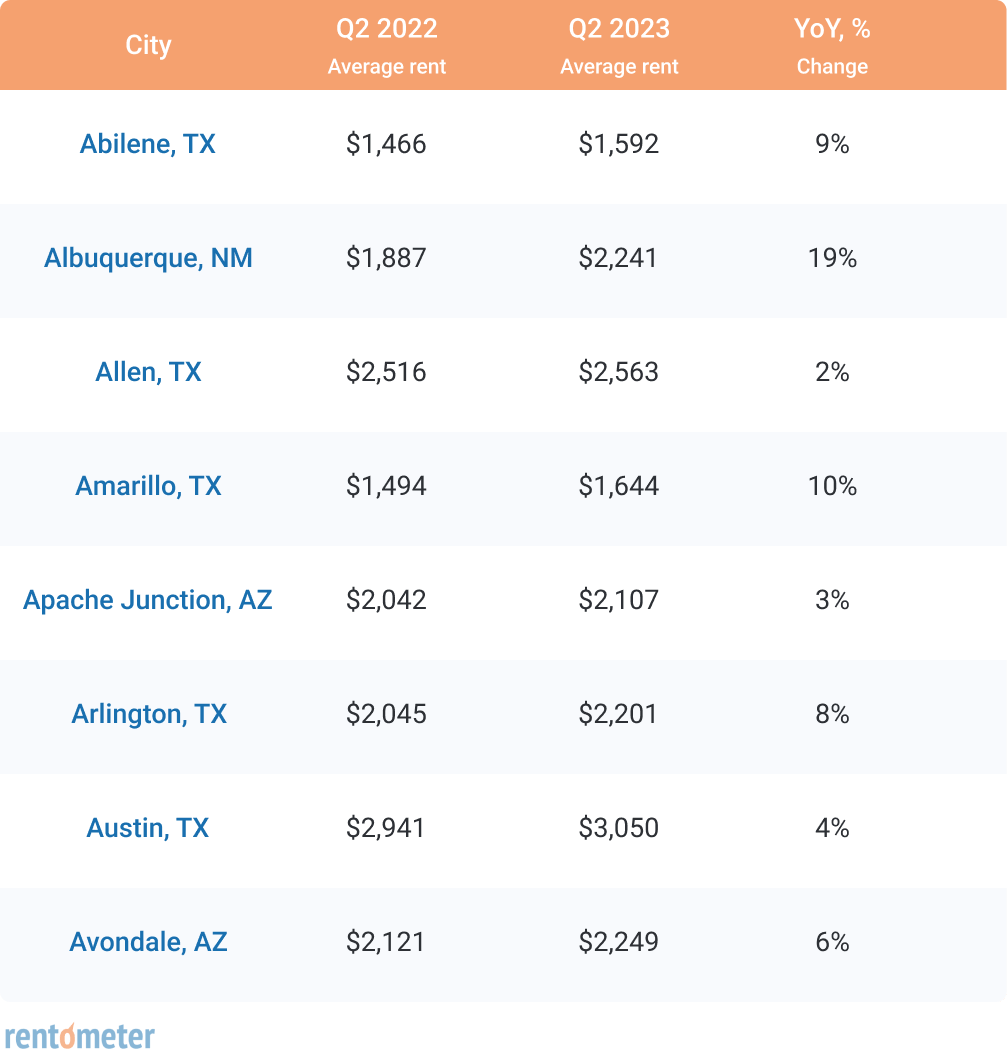
Southwest Rent Price Analysis
Rent Price Changes in the Southwest
In the Southwest, Dallas, Texas had the largest year-over-year rent increase of 34%, while Cypress, Texas had the largest decrease of -9%.
Rent Prices in Popular Southwest Markets
- Austin, TX rent for a 3-BR SFR: $3,050
- Dallas, TX rent for a 3-BR SFR: $2,991
- Houston, TX rent for a 3-BR SFR: $2,241
Conclusion
Rentometer will continue to monitor rent prices throughout the second half of 2023 to see how they are impacted as the housing market continues to evolve. It is important now more than ever to know the market rent in your area to remain competitive and make informed real estate decisions. To access rent data in your area, click here.